The race for resources
A week ago one of our readers, Cedric, submitted a PHP web shell he found on a compromised server.
PHP web shells are a pretty common thing – once attackers identify a vulnerability that allows them to upload such a PHP file (which is usually a RFI, Remote File Inclusion, vulnerability), they install it to make further activities easier. PHP web shells have gone a long way and are today very powerful. The attacker can use a PHP web shell to navigate through directories, upload and download files and do much, much more.
One of the more well-known and publicly available such multi-purpose web shells is the Ani-Shell. Ani-Shell is a PHP web shell that, among the regular functions such as file management also supports features such as MD5 cracking, where the attacker simply uploads a list of MD5 hashes and a dictionary, after which the shell tries to crack the submitted hashes.
Of course, any publicly available PHP web shell has million spin-offs. Cedric found one such PHP web shell called PHPJackal which again, among the regular functions, has quite a bit of extra features. The PHP web shell was renamed to .database.php, and you can see the main interface in the figure below (the screen showing the port scanning module):
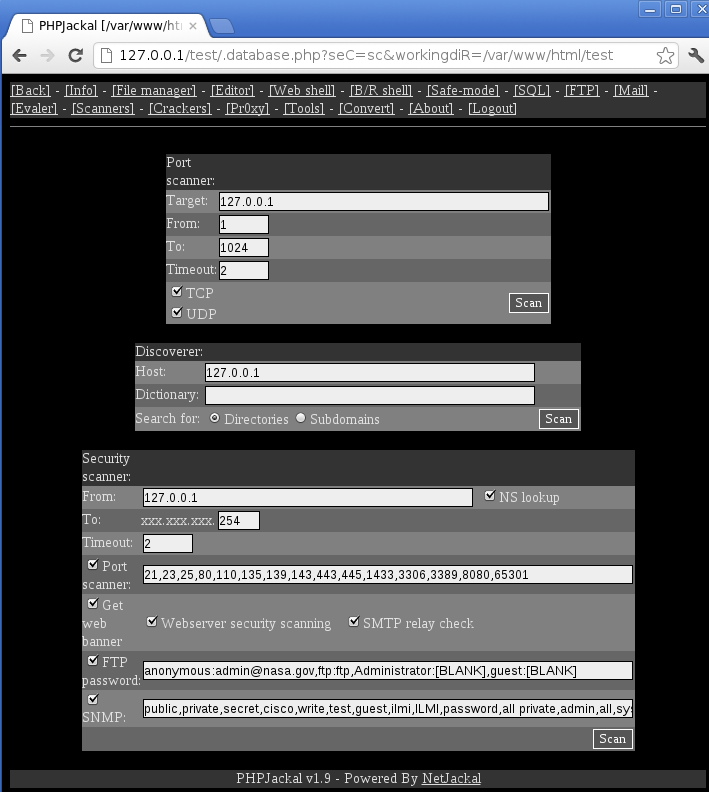
We can see that through time attackers added quite a bit of extra features. The Crackers screen of PHPJackal is particularly interesting: it contains 10 modules that allow cracking attempts on various services: starting from uploaded MD5 hashes similarly to the mentioned Ani-Shell, but also to live, remote cracking of SMTP, POP3, IMAP4, SNMP, MySQL and MSSQL databases as well as HTTP form and basic authentication protected web pages. What else could an attacker wish for?
The number of such compromised web sites is staggering. What’s even worse, such servers usually have a lot of CPU power and network bandwidth, so attackers can easily abuse them to launch other attacks such as mentioned cracking of passwords or even DoS attacks. In fact, Cedric found the mentioned shell by monitoring firewall logs – the attacker launched a simple HTTP Connect DoS attack on a different web site causing the main firewall to log warnings about a high number of connections.
Identifying such compromised sites can be particularly challenging for web hosting companies, which do not have direct control over implemented web sites. As always in security, we cannot rely on one thing but have to monitor the whole environment: if you see CPU usage spikes or high bandwidth coming from a server, such events should be further investigated. Of course, first we have to make sure that we have monitoring that can catch such cases implemented, so start today (if you haven’t already); I’m sure that in 6 months you’ll be glad that you did this.
--
Bojan (@bojanz)
INFIGO IS


Comments
Many years ago when a particular DB vendor whose name starts with O but shall be unnamed, had a bug on itanium and would occasionally run amok consuming almost all CPU/memory until the system became unusable, I made a nagios plugin to throw an alert when SysCPU usage rose above certain thresholds and paged the DBAs so they could log in and get debugging info to help prove to the vendor that they had a bug before the system had to be rebooted. That same plugin has been useful for detecting abnormal I/O Wait times, etc. Search exchange.nagios.org for sgichk_snmp_system if you're curious. I even made a pnp4nagios template and a nagvis gadget for dashboards.
Brent
Jun 25th 2013
1 decade ago
JacL
Jun 25th 2013
1 decade ago
I'm still looking for a glove that fits!
Something lightweight should collect samples for me, an RRD should archive those, and something should apply thresholds to the min/max, moving average or standard score, to determine when something's amiss. Then it should inform me and include some recent log excerpts, attach graphs comparing this against data from yesterday / last week, take some other actions like firing off pings, running a traceroute, trying some HTTP requests, and/or create a note on a public status page, etc...
Steven Chamberlain
Jun 25th 2013
1 decade ago
So, for instance, the sgichk_snmp_system plugin I made gets CPU usages, memory and swap usage, swapping and paging I/O rates, and load averages and all of that perfdata gets logged in RRD. And I've got a pnp4nagios template that arranges it in a few sensible graphs.
If you have no pnp4nagios template and don't feel like making one, the default is to just make one graph per element of perfdata the nagios plugin returns.
I use it for graphing ping times, web service times, stats on messages blocked, quarantined, or tagged by barracuda spam firewalls, temp sensors, fan RPMs, even predicted UPS Battery run times. Nice add-on...
Brent
Jun 25th 2013
1 decade ago
http://munin-monitoring.org/
Jeff G
Jun 26th 2013
1 decade ago