Syslog Skeet Shooting - Targetting Real Problems in Event Logs
A common bit of advice that we tend to offer up frequently is "monitor your logs" or "review your logs periodically". However, with daily syslogs - even in a small environment - ranging from 300mb to 5GB, that's no easy task. We've discussed parsing logs out using grep and similar tools in the past, but that assumes that nothing drastic ever happens - you're banking on the fact that anything being logged can wait until you have time to check your logs.
And face it - with the volume of "real" project work that faces us each day, how many of us actually have time to manually review our logs, and get meaningful information out of them that we can take action on?
So, can we automate this task? Since there's a rather large number of for-sale products that do this (google SIEM to see just how many), the answer is a resounding "yes". But can you take a simpler approach, and send email alerts on specific things you know you want to watch for? And can you do this on a budget of zero or close to it? The answer to this is also "yes", read on!

Before we get to the "how" though, let's define the "what" - or at least start that task. What exactly do you want to monitor for? I'll focus on network gear in these examples - routers, switches, firewalls and so on. The list of conditions for alerting is fairly short, and network conditions affect *everything*. Plus I'm a "network person" most days. You can certainly expand this to include storage arrays, Windows and Linux hosts, Active Directory and so on.
Let's start with some keywords in log entries that would indicate environmental issues:
|
fan |
Of course alarms on any of these needs almost immediate action. Note that I'm looking for "temp", to include "temp" or "temperature" Similarly, "batter" covers "battery" and "batteries" |
You'll also get these same keywords cropping up in logs for your SAN and for host hardware if you have proper logging set up for them.
You definitely want to alert on routing or redundancy Protocols - for the most part these only kick out a message when things are re-negotiating, which should never happen unless there is a problem:
BGP, EIGRP, OSPF. ISIS (or add your routing protocol here. Hopefully "RIP" isn't in your list). Monitoring for these will in lots of cases catch short outages with WAN providers or ISP's, which traditional polling will often miss.
HSRP, VRRP covers off most interface redundancy issues. If you see an event on either of these, it usually means you've seen a failure.
Another common, common, common thing that you really have to filter on:
duplex
'nuff said. I just had a client engage me for 5 days to nail down a high WAN traffic / performance issue. They didn't have a syslog server, but I started by looking at logs in memory (over their objection). And yes, their WAN provider had changed one of their routers from auto/auto to 100/full, of course without telling them. Even in a well managed, controlled environment, you can't control the VOIP contractor who hard-sets their PBX to 100/full without telling anyone else, the ISP that does that to their routers instead of using rate limiting, or the server admin who thinks that setting their NIC to 1000/full is somehow "safer" than letting it negotiate to that same setting (the way the RFC recommends). And face it, the only things you get ever speed/duplex errors on are the most catastrophic things you could pick to have that error! Once you start looking, you are almost guaranteed to find a number of these in your logs in almost any shop.
Monitoring for vendor-specific text in a syslog message (Both Cisco in this case, though the first works for COMWARE as well):
DUPLICATE_IPADDR_DETECT - yes, lots of this too. I had a client stand up a new DHCP server without conflict detection. Ever wonder what happens when you have a busy workstation with the same IP as the local firewall?
ERR-DISABLE or ERR_DISABLE - as you'd expect, this is a switch port that's been disabled due to an error. What kind of error? Often it's a BPDUGUARD trigger, port channel config issues, link-flap, late collisions incorrect SFP or GBIC inserted, ARP inspection issues - this port state and syslog message cuts a wide swath.
BPDUGUARD - if you configure a switch port with BPDUGUARD, you're telling it that this is a workstation or server port, so if it sees a BPDU (Bridge Protocol Datagram Unit) frame, that indicates that there's an unauthorized switch attached to that port. (see ERRDISABLE above). A messing involving BPDUGUARD will generally also involve a shut down port. In Cisco and Comware, it'll be in an ERRDISABLE state. In Procurve networks though, it'll just be shut down, and if you don't check your logs you might be left wondering why it keeps shutting down.
You'll likely also want to monitor for config changes. If you don't have a formal change control process, it's something you really want to consider. If a router or switch configuration changes outside of a change window - or worse yet, if a config changes and it wasn't you, that's something you want to know about!
Monitor in real time for config changes, look for SYS-5-CONFIG_I
If you have the following lines in your cisco router or switch config:
login on-failure log
login on-success log
Then you can filter syslog for: SEC_LOGIN-4-LOGIN_FAILED and / or SEC_LOGIN-5-LOGIN_SUCCESS - or more simply, to catch both, watch for SEC_LOGIN
Really, you're looking for logins outside of approved windows, login failures (worst case, followed by success). Or if you are the only network admin, any login attempts that aren't you!
If you don't have those two lines in your configuration, I'd suggest that you add them, then review the Cisco Hardening Guides at the Center for Internet Security (https://benchmarks.cisecurity.org/downloads/browse/?category=benchmarks.network.cisco). Other vendors will have similar guidance, either on their own sites or at CIS.
You get my point. In a perfect situation, you would take your logs and discard everything you DON'T want to be alerted on, which should leave the real problems, and new messages that are not problems which you can add to your "filter out" list. Back in the day, we had a project where we did exactly this for an AS400 - we discarded "known good" and "known innocuous", over time we were just left with just the bad news messages we wanted to see. However, networks and log messages are so varied as you add new devices, and change so much even from version to version, that this traditional approach might not be so viable anymore. Alerting on specific messages, as well as regular manual log parsing to see what else you might want to add to the list, is a nice, low interaction approach that gets you there (or close to it) in the end. This has worked for lots of customers that I have, until they get a proper SIEM or IPS that is.
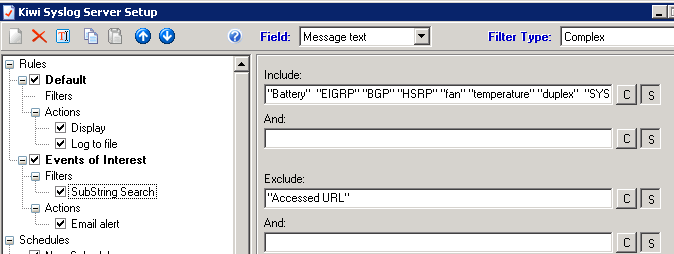
So back to the "how" - how do you configure alerts now that we know what we want to alert on? That will depend on your logging solution. If you use Solarwinds Syslog (used to be Kiwi), it's built into the GUI. You can trigger on various AND / OR situations - be sure that your seach are case-insensitive. As you can see from the example below, I EXCLUDE the string "URL Accessed" - this prevents bogus alerts from the firewall, for instance if one of the deskside folks browsing real-estate ad looking to purchase a duplex, or comparison shopping prices on fans or batteries.
In Linux, you'd think it would be easier. But as so many things in Linux, there are dozens of ways to do this - and they're all at least marginally more complicated. It's semi-easy to configure email alerts based on severity, as long as the local system mail is tied to a "real" email system (which is almost never). To trigger on keywords and support "real" email though requires some gymnastics. You can use logwatch, logcheck (you'll generally use logcheck with cron), also OSSEC also does a good job monitoring logs (amongst other things) and on cofigured inputs or conditions, alerting in any of several methods. If you want to do it all with stock tools, you can used named pipes as show here: http://serverfault.com/questions/32360/how-can-i-make-syslogd-email-certain-log-messages-to-me.
Me, I use swatch http://sourceforge.net/projects/swatch/ - mostly because it's simple and it works well. Life is too short to complicate a simple process like logging. For an example of using swatch "for real" - check my very first SANS Gold Paper - all those years ago - http://www.sans.org/reading-room/whitepapers/auditing/vpnscan-extending-audit-compliance-perimeter-1711. I used swatch to trigger policy audits of users VPN-ing in at the time, and I still use swatch for that, along with loads of other things.
What messages or strings would you add to this (short) list of things to alert on? We're looking mainly for network type alerts on routers, switches, firewalls, load balancers and so on. What situations would your list entry prevent or diagnose? Do you have a simpler or more elegant method of triggering on syslog entries in Linux? Please, use our comment form and let us know how you approach this issue!
===============
Rob VandenBrink
Metafore


Comments
Anonymous
Mar 11th 2015
1 decade ago
I've been using one called oak that's become my swiss-army-knife of log watching:
http://ktools.org/oak/
It's fast, scales well and does what I need. I can specify regex patterns, actions to take when they're discovered, how often to fire off that action, limits to how many log lines I want to see, and even what sorts of things to omit but count. For instance, if an IP address is seen trying to do outbound SMTP, I don't really want to see every firewall log line, but I would like to know how many that IP was seen matching that regex pattern in the log file in the last <period-of-time>. oak lets me do this.
So, that's one example of things I watch for - the number of systems that are allowed to do outbound SMTP at my dayjob are very, very small. Anything else trying to do outbound SMTP is either compromised or a misconfig (some engineer trying to run their very own mail relay or something silly). I also watch for outbound DNS queries being blocked. Unfortunately, with so many linuxes now using dnsmasq as a caching DNS client (whoever thought that was a good idea deserves a punch in the nose) I see tons of linux boxes trying to talk to the root servers or other outside DNS servers. But I still have a list of IPs belonging to "known malicious DNS servers" and oak watches for any DNS queries going to these IPs. And if/when I discover a bit of malware that changes the local DNS settings to point to some IP, I add that IP to my watchlist.
Another thing I've found very useful to watch logs for is DNS query logs. I have a watchlist of certain domains and hostnames that I watch for. We also do DNS filtering with RPZ in bind (VERY highly recommended). And I block/rewrite some DNS queries based on the IP/network a hostname would otherwise resolve to. (IPs or networks known to be hostile) So I have oak watching for hits on those specific rpz-ip rules. That's helped me catch a compromised system trying to phone home or doing a 2nd stage download. It's good to prevent that with DNS filters. It's better to also detect that it happened so you can wipe/re-install the system sooner rather than later.
I've found that as soon as you have an easy-to-use log-watching tool in place there's always new things to watch for. Chasing around a snowshoe-spammer and want to block any new subnets he's sending spam from pro-actively? Watch your logs for his domain names showing up on new subnets you've never seen 'em on, then scan the logs for that subnet and you'll get a whole new batch of domain-names to add to the watching tool and to your spam filters too.
For monitoring health of systems, I prefer nagios + nrpe + a module for checking a local log file, or better yet, an IPMI module. But as they say, there's gold in them thar logs, so it's worth setting up something to watch for "interesting" (tm) even if it's as simple a tool as oak and you don't have a budget for a full-blown SIEM...
Anonymous
Mar 11th 2015
1 decade ago
I'd also suggest that admins have a look at this URL for a guest diary I wrote on possibly losing system logging information due to rate limiting issues:
hxxps://isc.sans.edu/diary/Are+you+losing+system+logging+information+%28and+don%27t+know+it%29%3F/15106
Bill
Anonymous
Mar 11th 2015
1 decade ago
Anonymous
Mar 11th 2015
1 decade ago