Data Visualization,What is your Tool of Choice?
Over the years, I have used several types of graphing tools to visualize data, some free some commercial and haven't really been able to find to perfect tool that lets me easily ingest and manipulate multiple any types of data in a single tool without having to modify something before ingesting it. The most common data I want to manipulate are various type of logs; either in real-time or consume that data later during an incident. Some of the more flexible tool I have used so far are yEd by yWorks and Gephi.
Both are pretty good tools but they cannot parse and display data in real-time and there are limits in how much data to consume. If too much data is consumed, it become very difficult to view the relationships but it is useful and practical for post analysis.
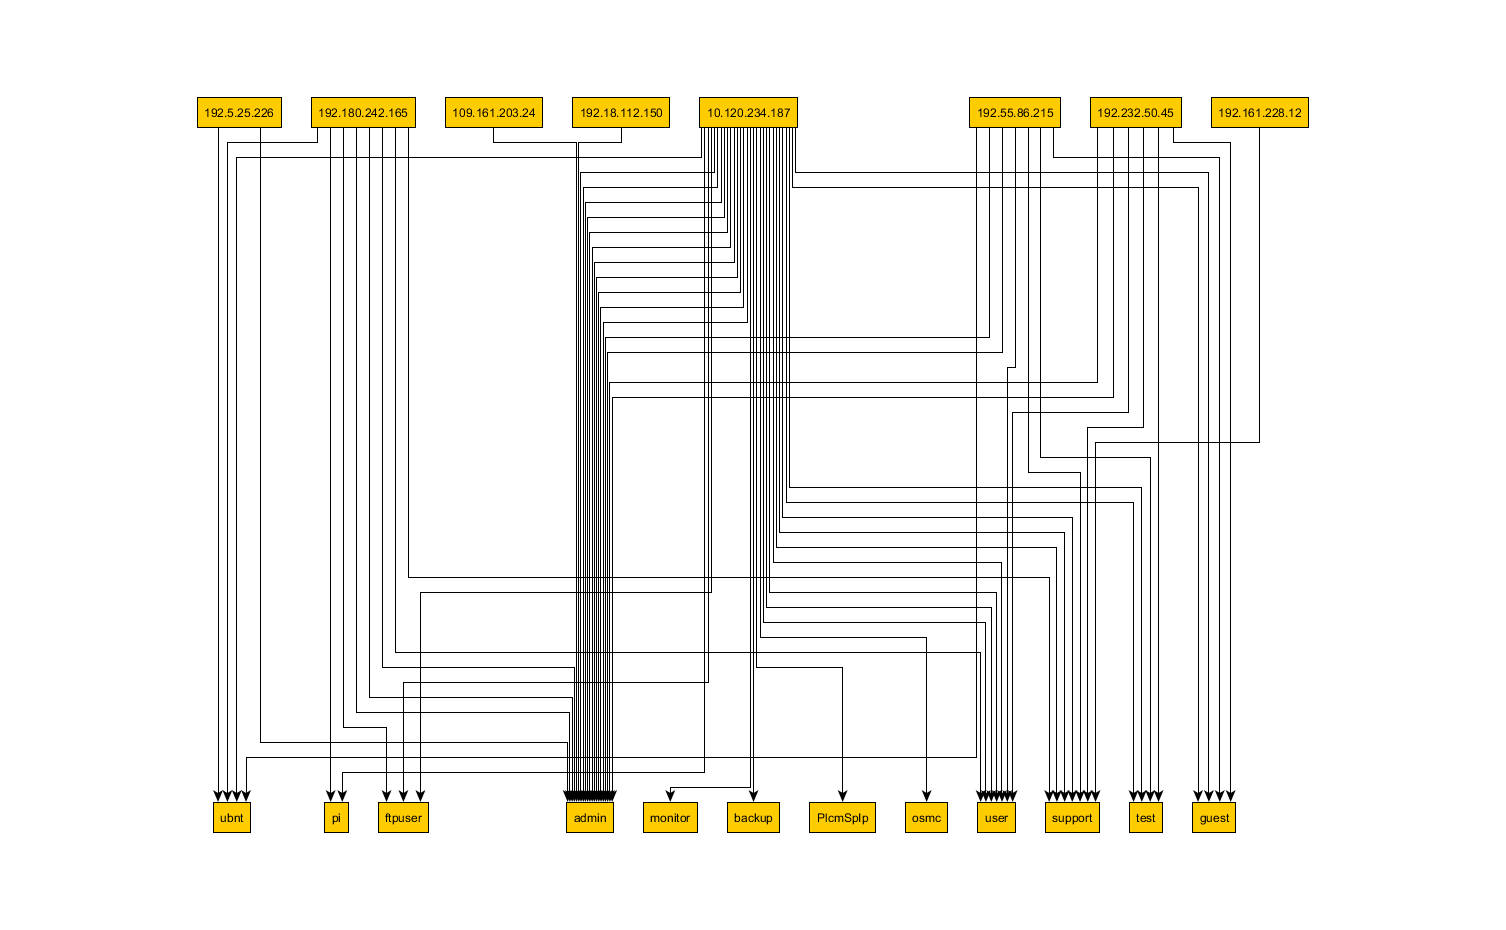
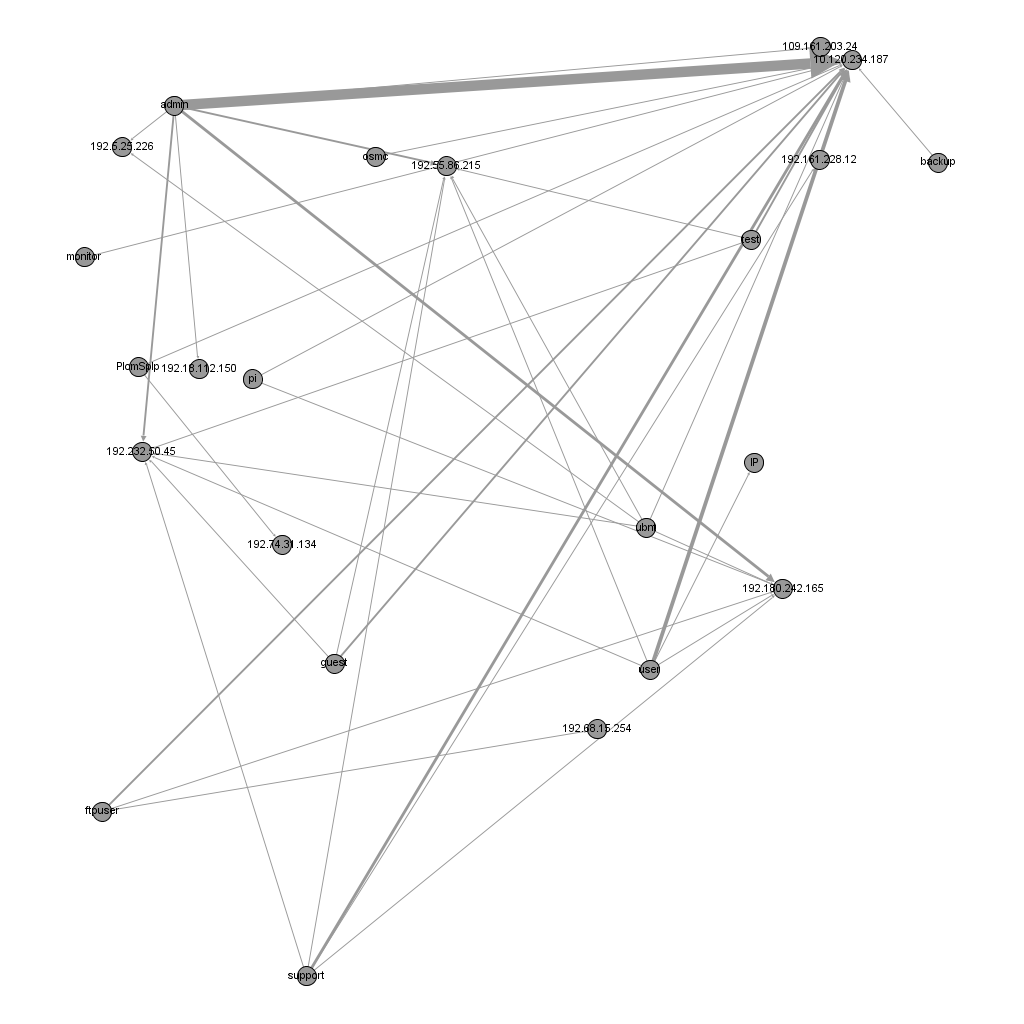
Using the same data file, here is a display from each tools. Gephi can ingest CSV comma delimited formatted data, however, with yED the CSV must be converted to Excel 97-2003 Workbook format first before it is process. If you plan on trying out Gephi, you need to JDK 1.7 in order to run the application, information on how configure gephi.conf is available here.
yEd Visualization
Gephi Visualization
I have listed a few of the tools I have used and tried before. I you have used other tools that provide good results, I would be interested to hear about it.
Free Tools
[1] http://www.yworks.com/en/products/yfiles/yed/
[2] http://gephi.github.io/
[3] http://www.graphviz.org
Community and/or Commercial
[4] https://www.paterva.com/web6/products/maltego.php
[5] http://www.sqrrl.com
[6] http://www.advizorsolutions.com/
-----------
Guy Bruneau IPSS Inc.
Twitter: GuyBruneau
gbruneau at isc dot sans dot edu


Comments
Anonymous
Oct 12th 2015
9 years ago
http://afterglow.sf.net is a tool that can help getting your log data into a graph format. I like to use that along with Gephi. I use treemaps a lot and parallel coordinates (see Mondrian, for example). And R. Learn R. It's powerful and with ggplot2 it's a great tool to visualize smaller amounts of data. Which, by the way, is true for all these tools. Keep your data small.
Anonymous
Oct 12th 2015
9 years ago
Anonymous
Oct 12th 2015
9 years ago
Anonymous
Oct 13th 2015
9 years ago
Anonymous
Oct 13th 2015
9 years ago
Anonymous
Oct 14th 2015
9 years ago