Analysis of SSH Honeypot Data with PowerBI
I have been experimenting for a while with Microsoft PowerBI (1) using honeypot data, parsing it into comma delimited (CSV), sorting this data in a way that is easier to manipulate and visualize.
For this report, I used my SSH honeypot logs of 2022 to view the top scanner and the ownership of each IP by AS Network and country code.
Using regular expression, I used the following command using Linux pipe (|) to parse the honeypot logs into a file containing the date, IP address, SSH type use and add 1:
grep SSH tcp-honeypot-20220703-114801.log |sed 's/\\n.*//g' | sed 's/\\r.*//g' | sed 's/\([[:digit:]]\{,8\}\)-.*: 192.168.25.9:[[:digit:]]\{1,5\}-\([[:digit:]].*\):[[:digit:]]\{1,5\} data .\(SSH.*\)/\1,\2,\3/g' | grep -v Python | sed '1i\Date,IP,SSH,Total' | sed 's/\([0-9]\{4\}\)\([0-9]\{2\}\)\([0-9]\{2\}\)\(,.*\)/\1-\2-\3\4,1/g' > /tmp/ssh_activity.csv
Sample Output
Date,IP,SSH,Total
2022-01-16,92.255.85.237,SSH-2.0-libssh_0.9.6,1
2022-01-16,112.85.42.28,SSH-2.0-PUTTY,1
2022-01-16,212.6.50.21,SSH-2.0-libssh-0.6.3,1
2022-01-16,122.194.229.45,SSH-2.0-PUTTY,1
Next step was to get some additional information on each IP, its AS Network and country location. My script used the following command to get the data from the database file:
mmdblookup --file /usr/share/GeoIP/GeoLite2-Country.mmdb --ip $IP country iso_code
mmdblookup --file /usr/share/GeoIP/GeoLite2-ASN.mmdb --ip $IP autonomous_system_number
Sample Output
IP,Country,ASN
99.97.212.80,US,7018
99.96.122.99,US,7018
99.61.199.183,US,7018
99.43.32.83,US,7018
A copy of the parsing script is available here. The script read the IP address and query the 2 database files to build a list (.csv) that can be imported into PowerBI.
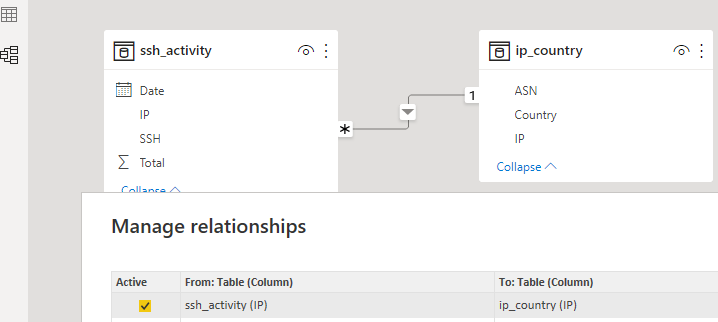
After completing these steps, import both files into PowerBI. Last step is to confirm Manage relationships between the two files using the IP address field. Select Model and Manage relationships and confirm the IP address are linked together:
Now I can proceed to build the visualization I need to see various statistics of the SSH activity since the beginning of January 2022. This first picture the overall activity of the two CSV files imported into PowerBI:
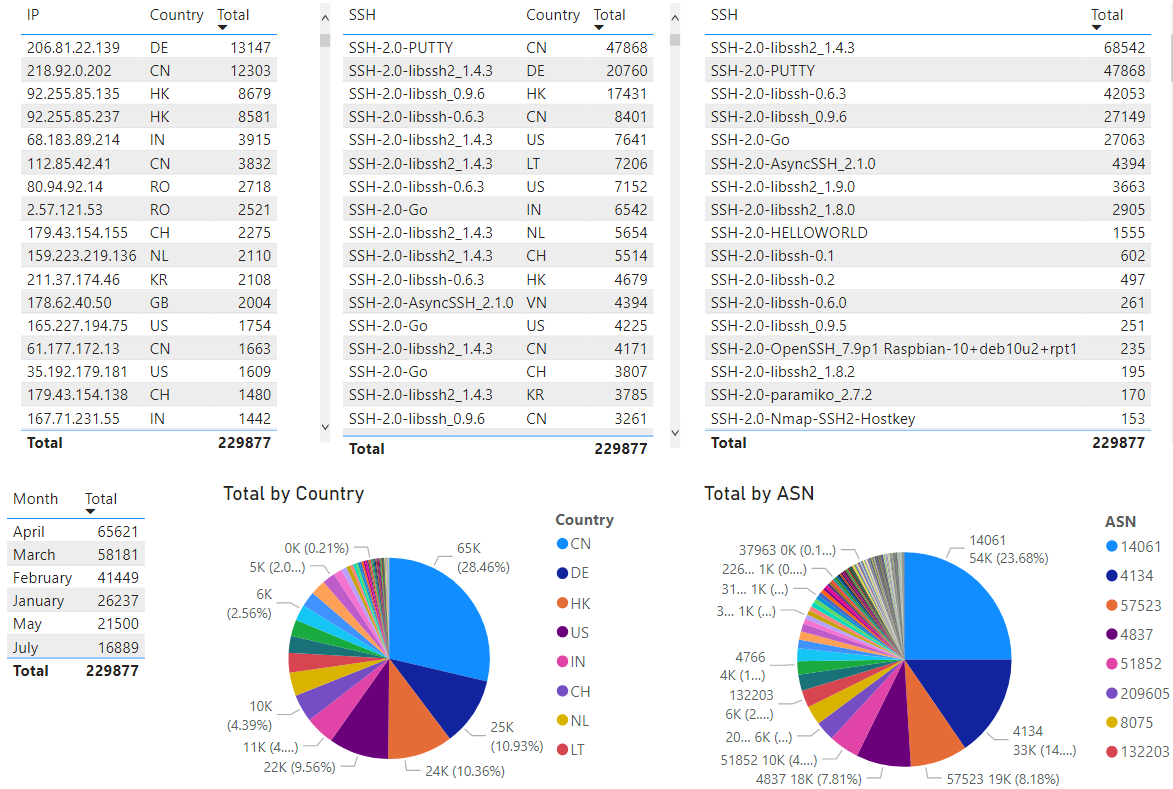
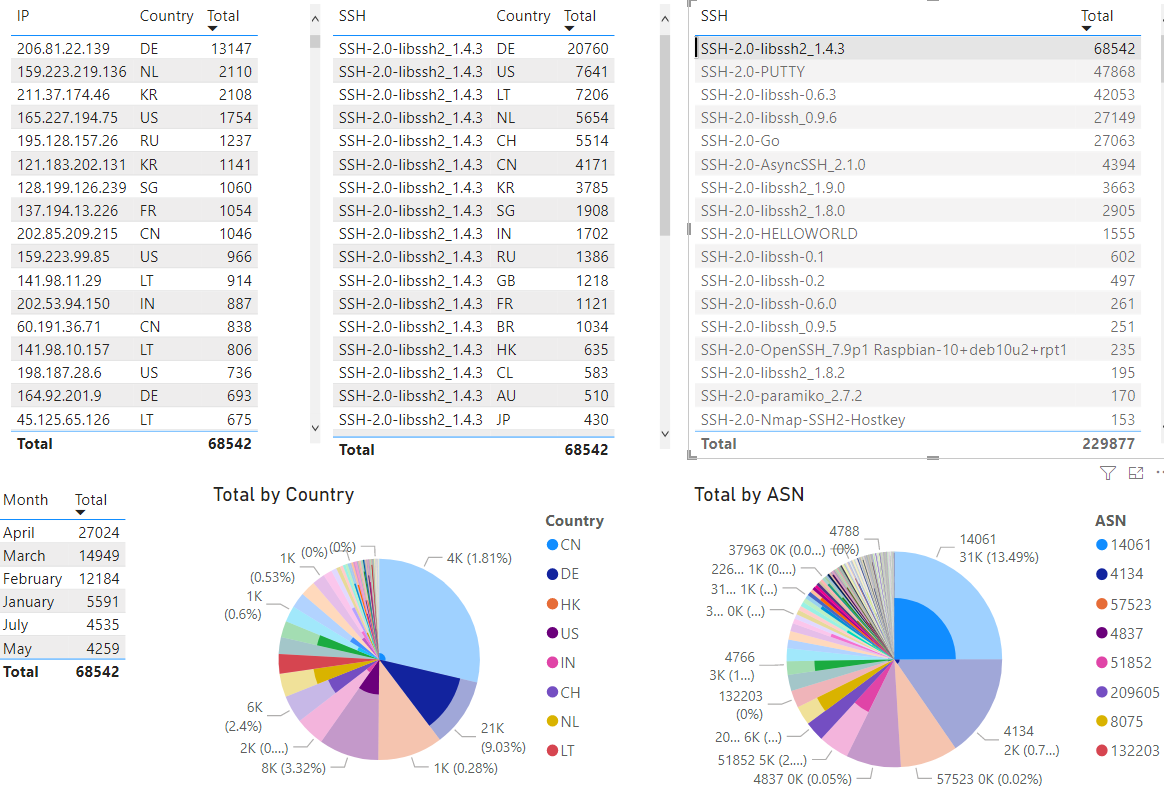
The above picture depicts all the logs imported into the tool. At this point, anything selected will automatically refresh all the graphs to show the activity selected. This next selection shows the top SSH banner captured over the past 7 months (SSH-2.0-libssh2_1.4.3):
I have SSH logs going back to 2018 and this last selection got me curious because it is the first time I have ever seen this SSH banner (HELLOWORLD) starting this month.
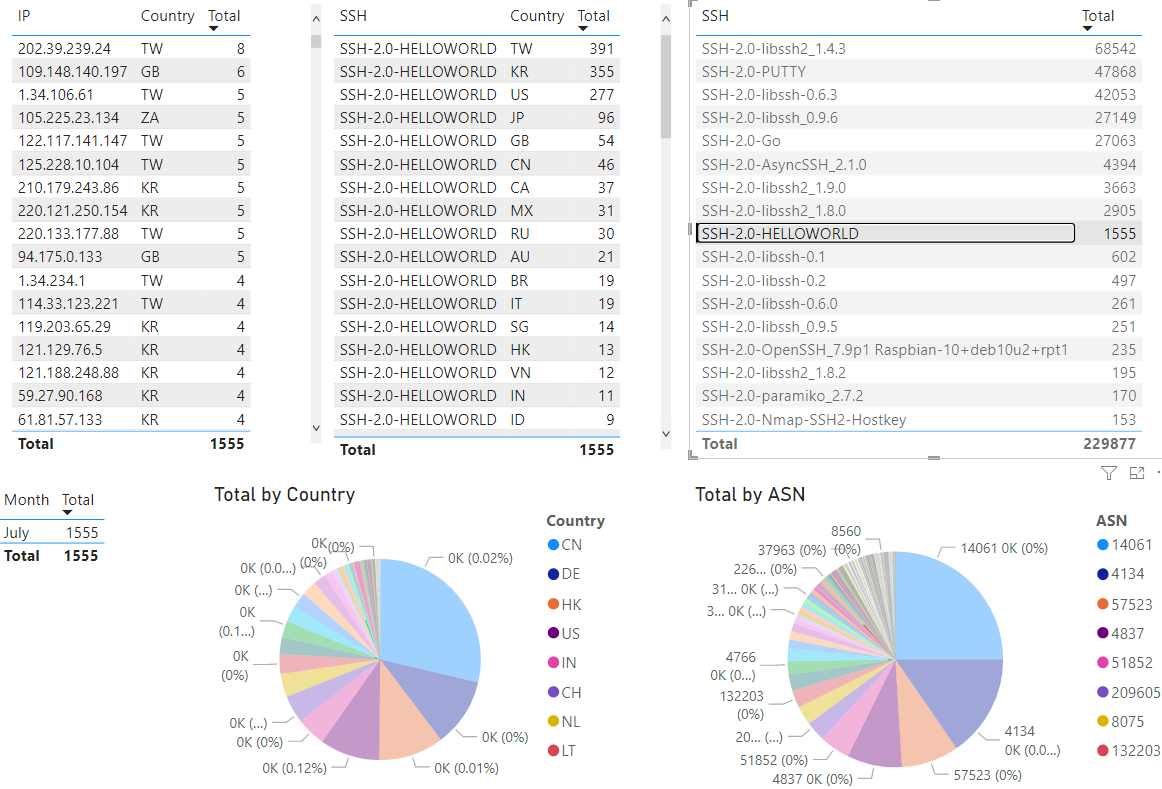
When any of the data is selected, this tool automatically refreshes the data and the Total to match the selection. It is a quick and easy way to analyze any parts of the data stored into PowerBI. PowerBI support many data format including databases, Excel, CSV, text, Web, cloud, etc.
If you want to try out PowerBI, I have shared a copy of the logs from this diary which can be open into a PowerBI available for download here.
[1] https://powerbi.microsoft.com/en-us/downloads/
[2] https://handlers.sans.edu/gbruneau/scripts/process_geoip.sh
[3] https://installati.one/centos/7/libmaxminddb-devel/
[4] https://maxmind.github.io/libmaxminddb/mmdblookup.html
[5] https://gist.github.com/reanimat0r/dd0ef5005f307d781c622ac446770c13
[6] https://handlers.sans.edu/gbruneau/scripts/diary_logs.pbix
-----------
Guy Bruneau IPSS Inc.
My Handler Page
Twitter: GuyBruneau
gbruneau at isc dot sans dot edu


Comments