Using Logstash to Parse IPtables Firewall Logs
One of our reader submitted some DSL Modem Firewall logs (iptables format) and I wrote a simple logstash parser to analyze and illustrate the activity, in this case it is all scanning activity against this modem. An iptables parser exist for Filebeat[2], but for this example, I wanted to show how to create a simple logstash parser using Grok[3] to parse these logs and send them to Elastic.
The Logstash Configuration Parser
# Guy Bruneau, guybruneau@outlook.com
# Date: 13 Feb 2021
# Version: 0.1
#
# Parse to Elastic Common Schema (ECS) format
# https://www.elastic.co/guide/en/ecs/1.7/ecs-field-reference.html
#
# This custom parser is parsing iptables type firewall logs dump data
# Wed Feb 10 23:59:29 2021 kern.debug kernel: [288253.168004] Firewall WAN DROP (SRC): IN= OUT= MAC=20:b0:01:6d:51:c4:a0:f3:e4:a3:1d:ba:08:00 SRC=xxx.xxx.xxx.xxx DST=xx.xxx.xx.xx LEN=40 TOS=0x00 PREC=0x00 TTL=245 ID=6607 PROTO=TCP SPT=55035 DPT=6981 WINDOW=1024 RES=0x00 SYN URGP=0 MARK=0x8000000
# Grab the logs file from filebeat which match the pattern /home/guy/logs
filter {
if [log][file][path] =~ "logs" {
grok {
match => { "message" => "^%{HTTPDERROR_DATE:timestamp}.*?%{LOGLEVEL:loglevel}\s+%{WORD:event.provider}:.*Firewall\s+%{WORD:interface.name}\s+%{WORD:event.action}\s+\(%{WORD:network.direction}\).*SRC=%{IP:source.ip}\s+DST=%{IP:destination.ip}\s+.*ID=%{WORD:event.id}\s+PROTO=%{WORD:network.transport}\s+SPT=%{INT:source.port}\s+DPT=%{INT:destionation.port}.*" }
}
}
}
# Format: Thu Feb 11 08:46:32 2021
# https://docs.oracle.com/javase/7/docs/api/java/text/SimpleDateFormat.html
filter {
date {
match => ["timestamp", "EEE MMM dd HH:mm:ss yyyy"]
target => "@timestamp"
}
}
# Add GeoIP information to destination hostname
filter {
if [log][file][path] =~ "logs" {
geoip { source => "source.ip" }
}
}
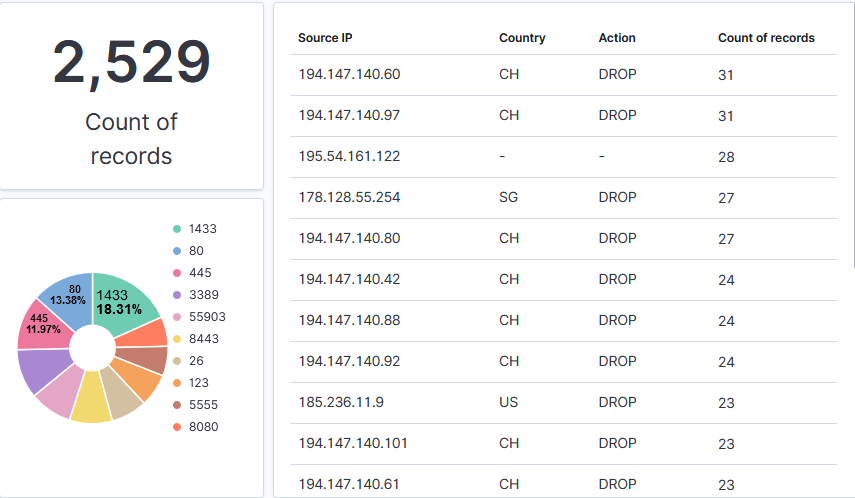
Now that the data is in Elasticsearch, I can create various reports based on the activity logged by iptables. The dashboards I prepared shows the number of records, the Top 10 targeted ports (services) and a table with the Top 10 sources with its location (GeoIP), action taken by the firewall and a total.
It is always a good idea to monitor and review the activity logged by the modem. If you aren't sure what to look for, we have tips published here as well as how you can participate and submit your logs to DShield, the service is open and free.
[1] https://www.elastic.co/downloads/logstash
[2] https://www.elastic.co/guide/en/beats/filebeat/7.11/filebeat-module-iptables.html
[3] https://grokdebug.herokuapp.com/
[4] https://isc.sans.edu/howto.html
[5] https://isc.sans.edu/forums/diary/Secure+Communication+using+TLS+in+Elasticsearch/26902/
-----------
Guy Bruneau IPSS Inc.
My Handler Page
Twitter: GuyBruneau
gbruneau at isc dot sans dot edu


Comments