Docker Containers Logging
- JSON-file (JSON messages written to a flat file)
- Syslog
- Journald
- GELF (Graylog Extended Log Format - used with Logstash)
- Fluent
- AWSlog (Amazon Web Services)
- Splunk
- ETWlogs (on Windows)
- GCPlogs (Google Cloud Logging)
/var/lib/docker/containers/(CONTAINER_ID)/(CONTAINER_ID) -json.log
# docker logs dshield
Validating provided credentials...
API key verification succeeded!
Starting cowrie...
Removing stale pidfile /srv/cowrie/cowrie.pid
# docker daemon --log-driver=--log-opt
DOCKER_OPTS='--log-driver=splunk \
--log-opt splunk-token=xxxxxxxx-xxxx-xxxx-xxxx-xxxxxxxxxxx \
--log-opt splunk-url=https://splunk.fqdn.tld:8088 \
--log-opt splunk-insecureskipverify=true \
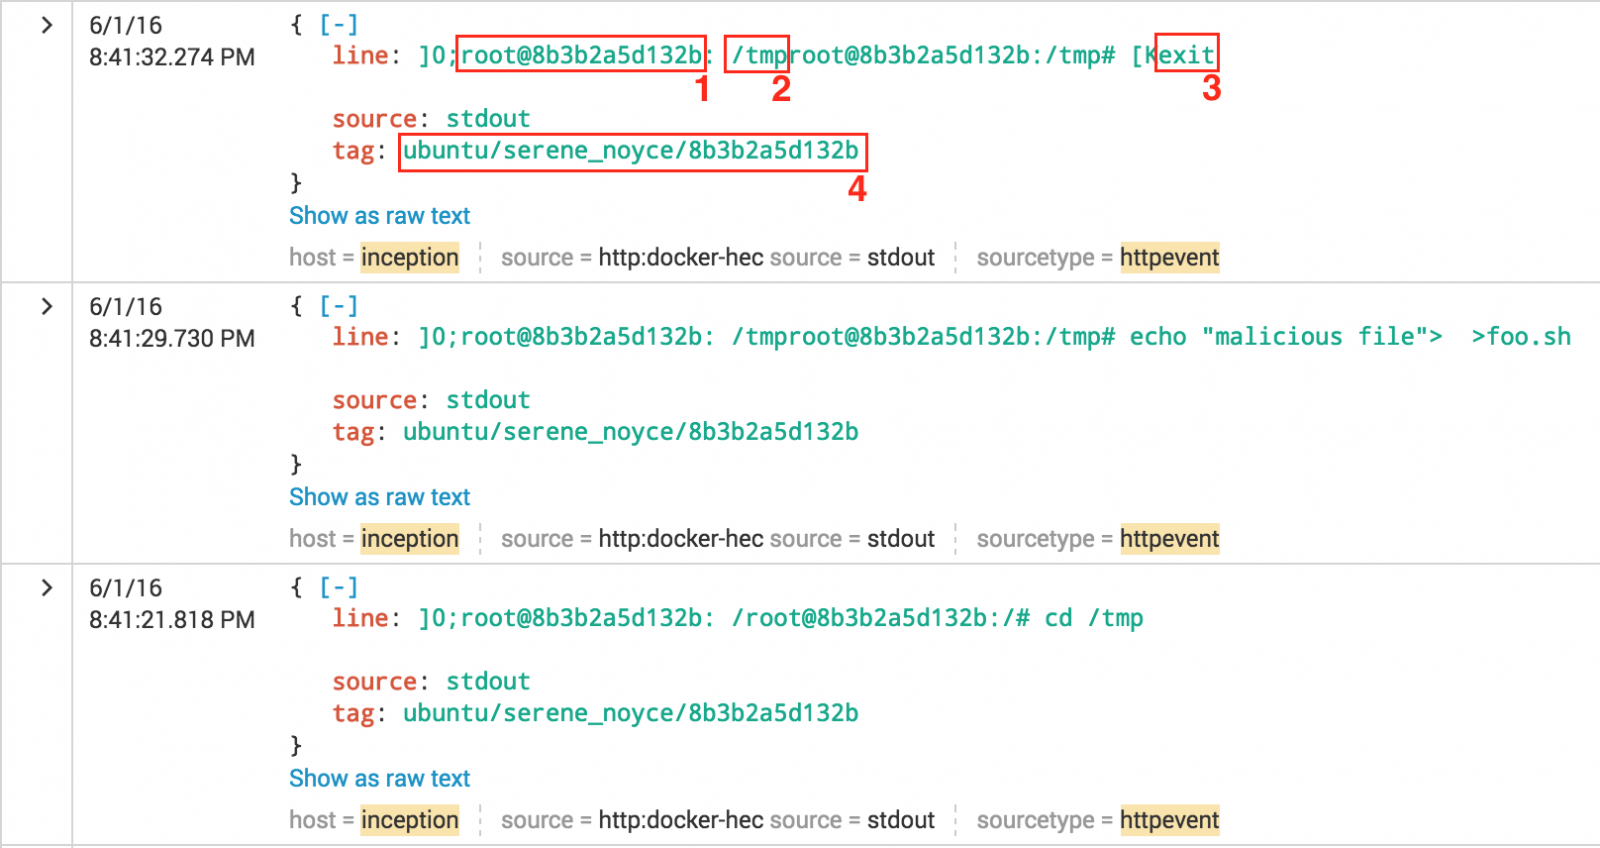
--log-opt tag="{{.ImageName}}/{{.Name}}/{{.ID}}" \
--log-opt labels=type,location'
# Set the timezone
RUN echo "Europe/Brussels" > /etc/timezone
RUN dpkg-reconfigure -f noninteractive tzdata
# iptables -L FORWARD 1 -j LOG
This will generate extra Syslog events (can be a huge amount!). The first one is an ongoing connection from a container, the second is an incoming connection:
Jun 1 20:15:36 inception kernel: [8415191.429757] IN=docker0 OUT=eth0 PHYSIN=veth2ad35f6 \ MAC=02:42:c6:a7:b3:f2:02:42:ac:11:00:04:08:00 SRC=172.17.0.4 DST=172.16.0.10 LEN=52 TOS=0x00 \ PREC=0x00 TTL=63 ID=15759 DF PROTO=TCP SPT=41017 DPT=25 WINDOW=229 RES=0x00 ACK URGP=0 Jun 1 20:59:10 inception kernel: [8417805.742798] IN=eth0 OUT=docker0 \ MAC=c2:41:32:db:26:fc:00:00:24:d0:69:51:08:00 SRC=5.45.72.51 DST=172.17.0.6 LEN=140 TOS=0x18 \ PREC=0x20 TTL=117 ID=7085 DF PROTO=TCP SPT=50424 DPT=2222 WINDOW=512 RES=0x00 ACK PSH URGP=0
In many applications and products, the default settings lack of proper logging. Be sure sure to review the settings to generate enough events to investigate later! Happy hunting...
Xavier Mertens
ISC Handler - Freelance Security Consultant
PGP Key
Performing network forensics with Dshell. Part 2: Decoder development process
by Manuel Humberto Santander Pelaez (Version: 1)
We saw in part 1 how useful dshell can be. Let's talk about the decoder development process. You can develop the following decoder types:
- PacketDecoder: This type of decoder is able to look for specific packet information in a live capture or PCAP file and then show it to the user in a customized way.
- SessionDecoder: This type of decoder is able to get information from a complete protocol session, from the initial connection to the end of the session.
Dshell has the following classes that can be used to develop the decoders:
- dfile: Dshell class to handle file functions, wheter files are on memory or disk.
- dnsdecoder: Dshell intermediate class used to support DNS-based decoders
- dshell: Base class used to initialize the decoder to work in the framework. You can choose to use IPDecoder, IP6Decoder, UDPDecoder, UDP6Decoder, TCPDecoder, TCP6Decoder,Data, Packet, Connection or Blob.
- httpdecoder: Dshell intermediate class used to support HTTP-based decoders
- util: Dshell class providing useful functions like decode_base64 to decode base64 strings, printableText to print just ASCII-printable chars to the screen, printableUnicode to print unicode text without the control characters, hexPlusAscii to return hex dump in a two-column presentation for binary input, URLDataToParameterDict that parses URL format string, strtok to tokenize a string as used in C and xorStringDecode used to decode xor from string char.
- smbdecoder: This decoder extend dshell.TCPDecoder to handle SMB Message Requests/Responses.
Let's see an example of a simple decoder, which uses dpkt library as well:
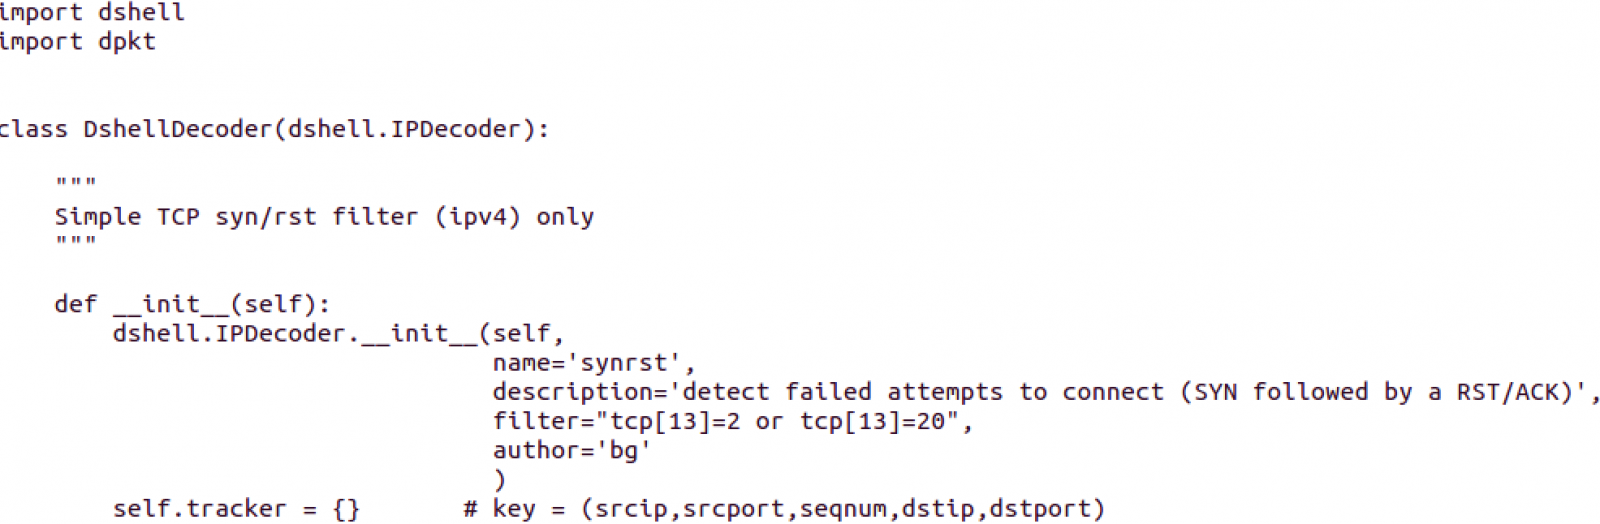
This looks like a packet decoder, using the base definition of IPDecoder contained in the Dshell class.
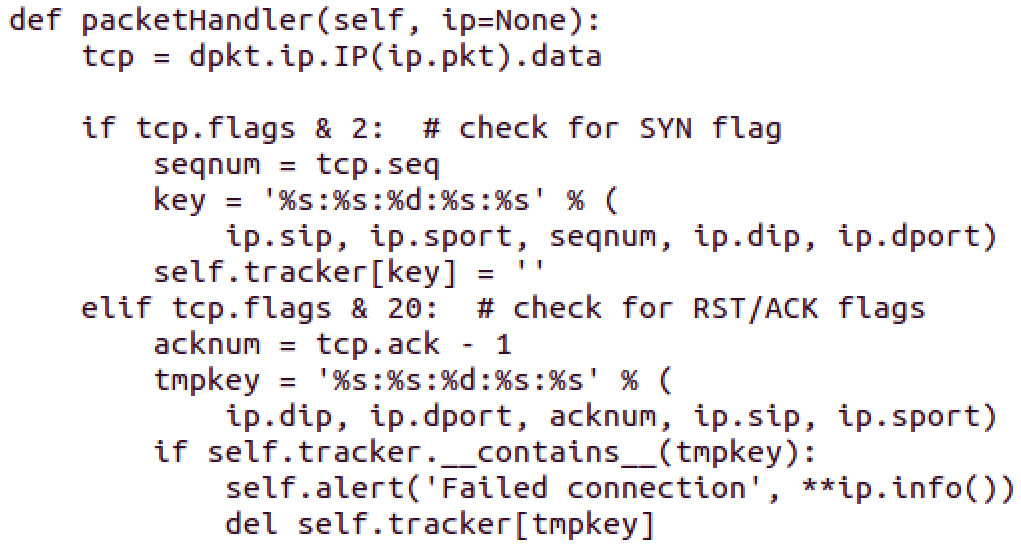
This function is part of all Packet Decoders. In this case, the dpkt library is used to dissect the IP packet to get just the TCP Header into the tcp variable. After that:
- If SYN flag is set, the source port, destination port, source IP, destination IP and sequence number are printed
- If not, if RST/ACK flags are set, the source port, destination port, source IP, destination IP and sequence number are printed
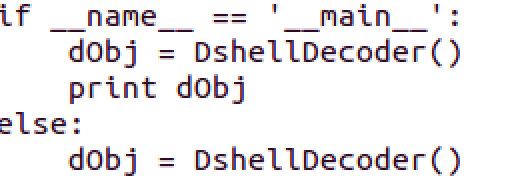
Dshell is instantiated. The whole code looks like this:
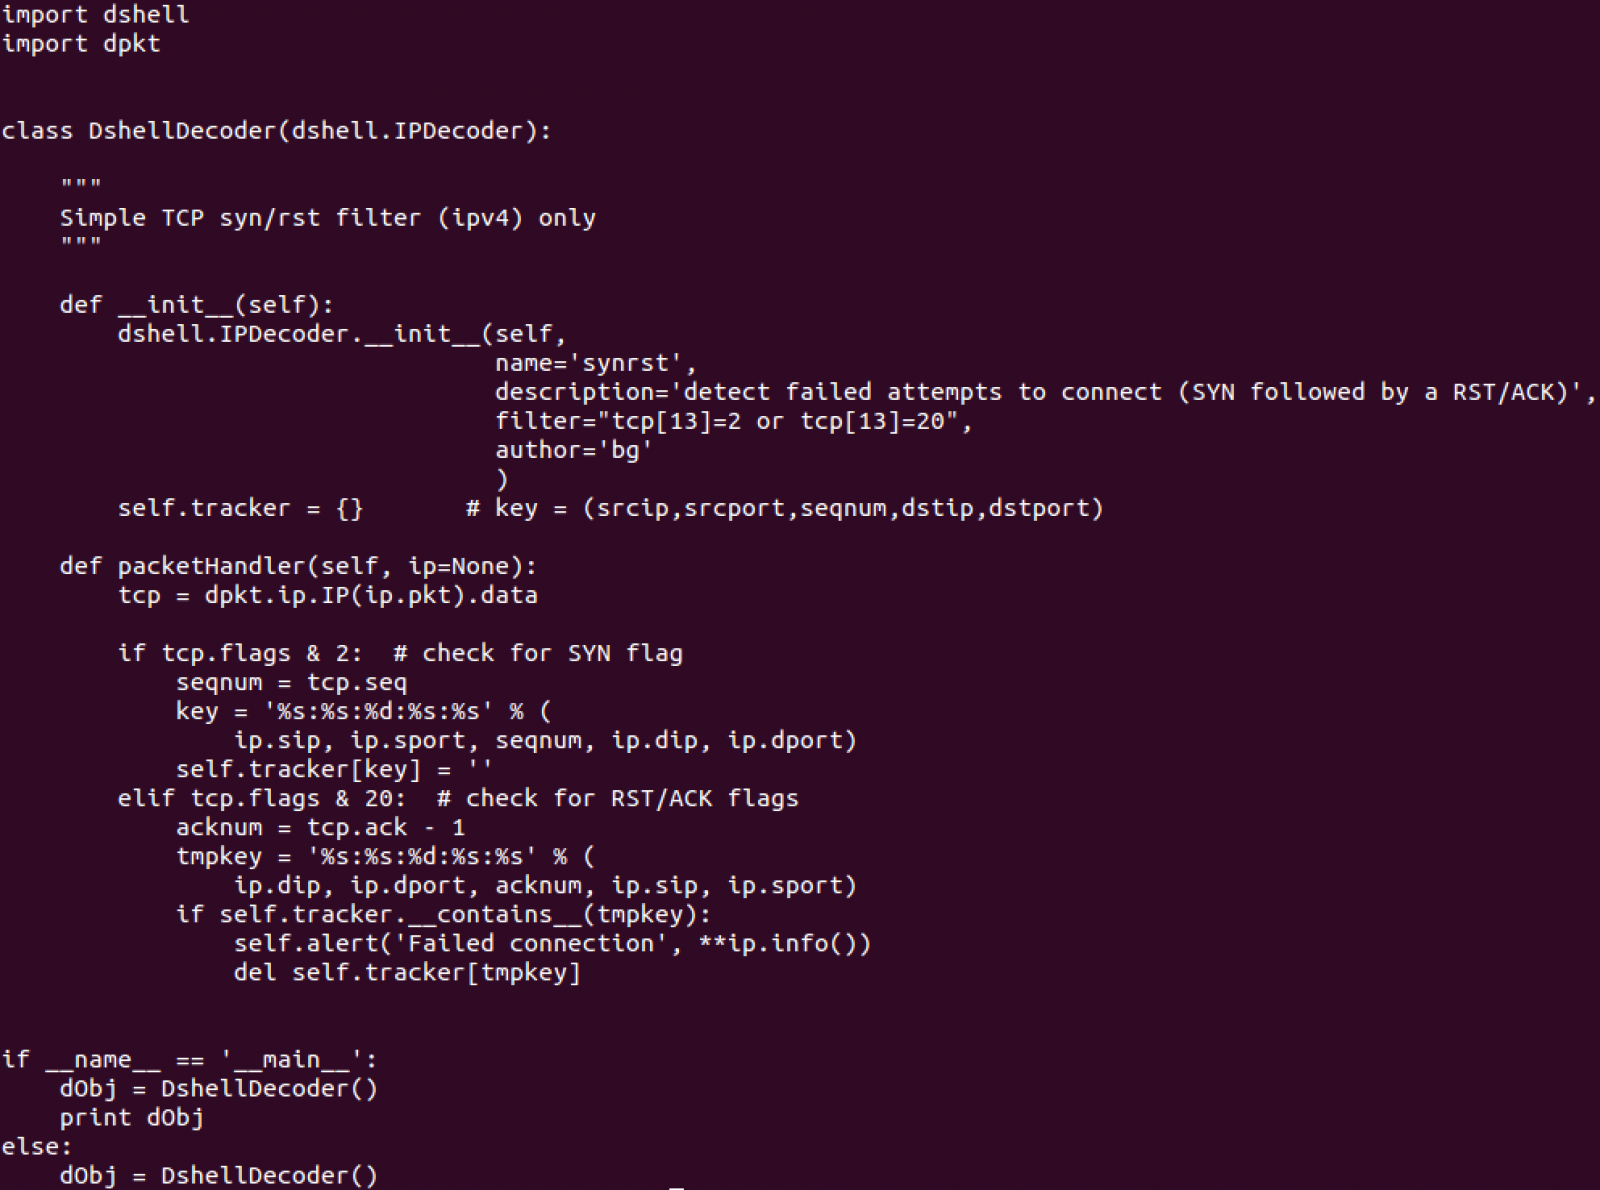
You can find this and other examples inside the decoders directory of Dshell.
Manuel Humberto Santander Peláez
SANS Internet Storm Center - Handler
Twitter: @manuelsantander
Web:http://manuel.santander.name
e-mail: msantand at isc dot sans dot org


Comments